[vc_row type=”in_container” full_screen_row_position=”middle” column_margin=”default” column_direction=”default” column_direction_tablet=”default” column_direction_phone=”default” scene_position=”center” text_color=”dark” text_align=”left” row_border_radius=”none” row_border_radius_applies=”bg” overlay_strength=”0.3″ gradient_direction=”left_to_right” shape_divider_position=”bottom” bg_image_animation=”none”][vc_column column_padding=”no-extra-padding” column_padding_tablet=”inherit” column_padding_phone=”inherit” column_padding_position=”all” background_color_opacity=”1″ background_hover_color_opacity=”1″ column_shadow=”none” column_border_radius=”none” column_link_target=”_self” gradient_direction=”left_to_right” overlay_strength=”0.3″ width=”1/1″ tablet_width_inherit=”default” tablet_text_alignment=”default” phone_text_alignment=”default” column_border_width=”none” column_border_style=”solid” bg_image_animation=”none”][vc_column_text]Amazon is always improving, but it’s no secret that the platform still lags behind other digital advertising giants when it comes to offering insights in a simple, user-friendly format.Doesn’t mean this info doesn’t exist, but it can be difficult to find and even more difficult to finesse into something worthy of presentation.
With all its day-to-day metrics such as Sales, Spend, ACoS, NTB, it’s easy to get lost and lose sight of some of the high-level metrics your boss, direct reports, or clients want. After all, how often have you come to a meeting prepared with a full table of ACoS data only to be stumped by the question, “What products are performing best in the ads?” or, “How much are we spending on this product?”
Again, this information is available on Amazon, it just is hard to put into a simple report. Fortunately, with some time spent upfront with the steps in this guide (and the use of a few free tools), the whole process can be fairly quick.
Step 1: Pull an Advertised Product Report
You can find the report by logging into the Amazon advertising console, going to “Reports,” “Create Report,” and then clicking on “Advertised Product.” For the purposes of this article, we’ll use a Professional Seller account.
Note that there are differences between Vendor and Seller Advertised Product reports, but all the data we’ll be using to create dashboards in this article are found in both.
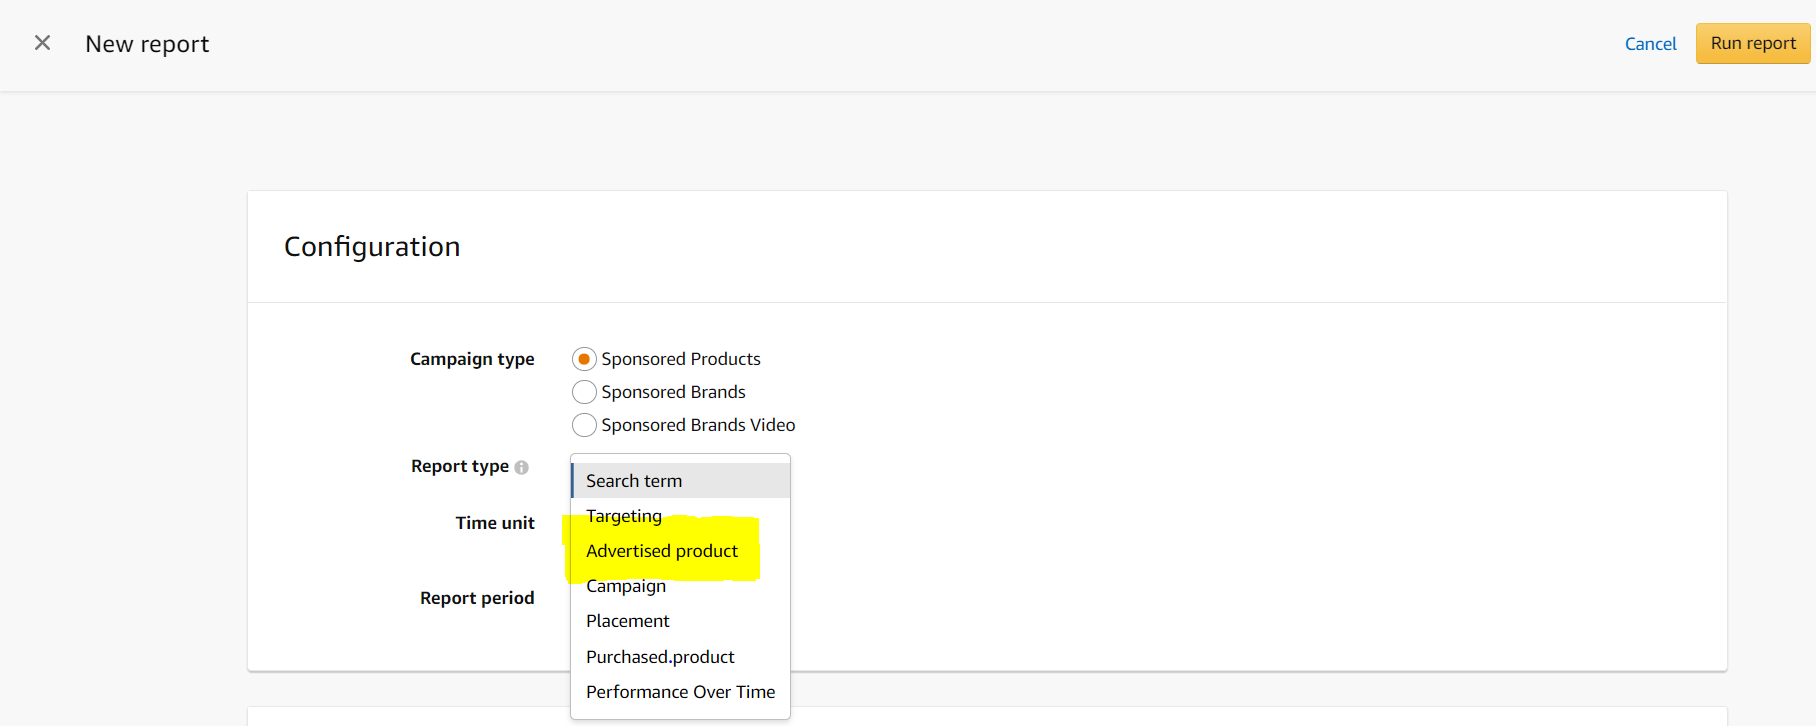
Once you’ve selected the report, you can set the time frame as well as the Time unit (either Summary, which will aggregate the product data over your selected Report period, or Daily, which will segment the product data by day — this can be a very large report if you have a large number of SKUs and cover a long Report period).
This can be a tedious process if you’re doing it every week — especially if there are other Amazon reports you need to pull and/or you manage other accounts. Fortunately, Amazon makes it a bit easier for you by offering the option to automatically have the report delivered to your email address (it doesn’t need to be your account login; it can be emailed to anyone).
For that, simply select the “Recurring” option under “Schedule,” set your frequency and preferred delivery day, and then select an appropriate End date — this is when the report will cease to regularly pull. If you are running recurring reports, be sure to take note of your End date, because you may want to extend the recurrence period!
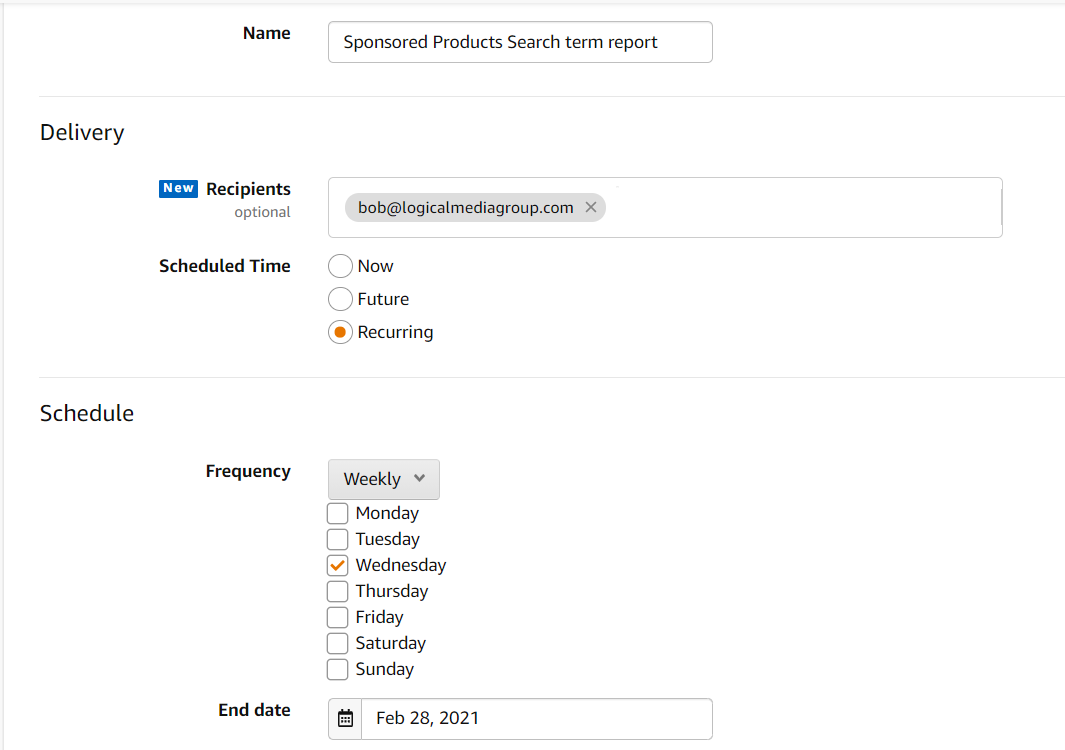
When configuring the report, it’s usually best to pull data at least a week (and preferably two weeks) in arrears — so if you’re pulling a report on the 25th, the latest data you’ll want to pull should be the 18th (and preferably the 11th). The reason is that revenue data for Amazon tends to have a good deal of latency — ad data such as clicks, spend, impressions and so on are fairly reliable in real time, but revenue (and in turn ACoS) are almost never real time. The nice thing is that you’re almost always in for a pleasant surprise each time you log in, with revenue increasing and ACoS decreasing, but the bad thing is if something is wrong with a campaign, it can take some time for you to notice.
Either way, always account for the lag time when pulling your reports.
We typically schedule ours to pull on a weekly basis, a week or two in arrears, and looking back over the last 30 days. That leads to pasting over a lot of data, but it’s going to be more accurate.
In terms of the report itself, whether the data is broken down by day, week, or month is entirely up to you, but if you’re following along with this guide, we recommend breaking the data down by month.
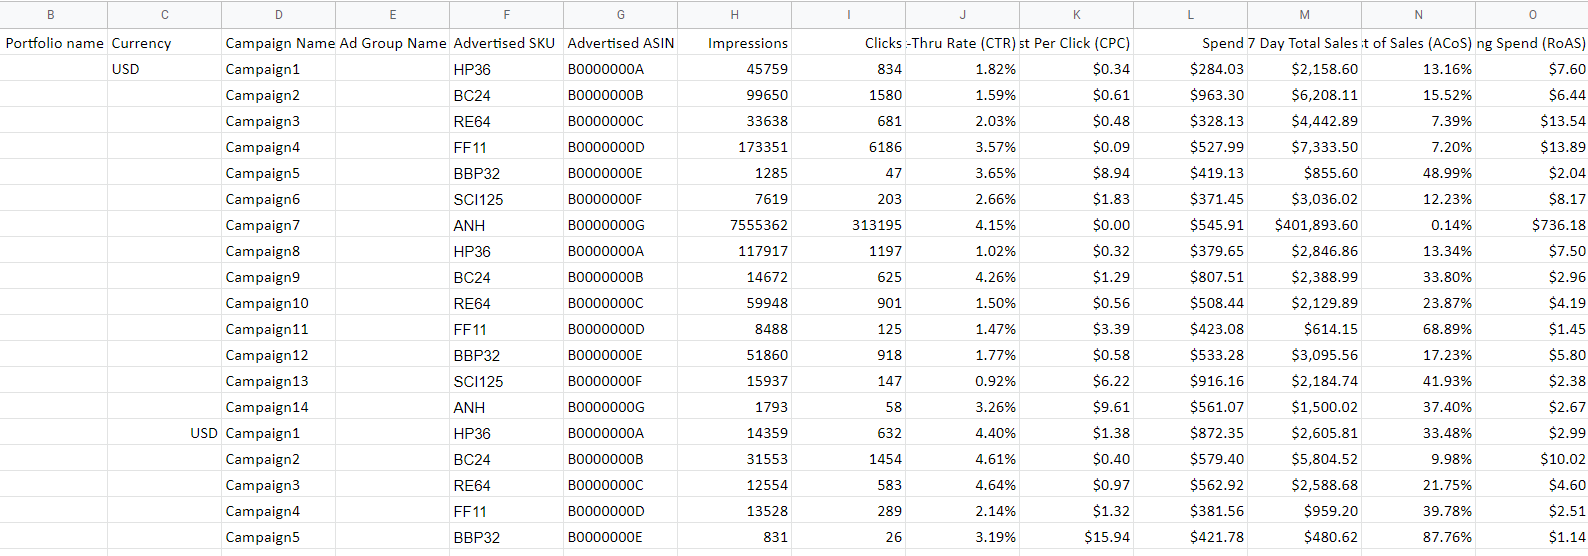
Ultimately, you should end up with something like this:
Step 2: Create a GSheet
GSheets are free to use very quick to set up (you can create on here: https://www.google.com/sheets/about/ ) — all you need to do is copy the data from your excel file and paste it into your GSheet.
If you have a dedicated team that handles the reporting, it’s a good idea to share access to the sheet with them (or anyone who may be updating the report on an ongoing basis).[/vc_column_text][vc_column_text]
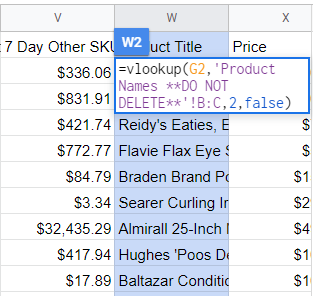
Adding Product Titles to Your Report
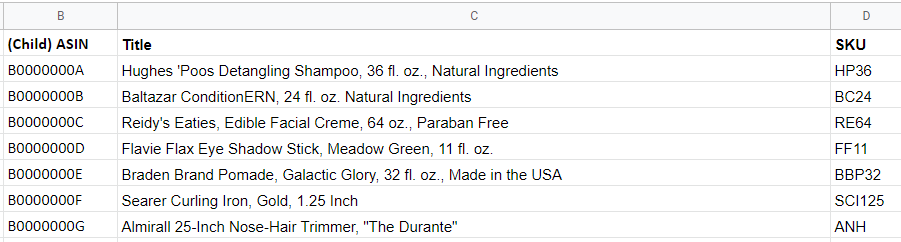
Advertised product reports give you the ASIN of your advertised products, but not the titles themselves, and this can make it difficult to quickly and easily know which product is which.
Fortunately, there’s a workaround: download your Amazon product catalog, making sure that you have both the Child ASIN (not parent) and the product title. Next, add a tab to your GSheet that says something to the effect of “Product Titles” and paste the ASIN and titles there.
Lastly, go back to your Advertised Product Report tab, and go to the leftmost column. Here you can write a VLOOKUP formula that uses the “Advertised ASIN” column as a search key, looks for the same ASIN on your Product Titles tab, and returns the product name.
 [/vc_column_text][vc_column_text]
Step 3: Create a Data Studio Dashboard
This is the last part! Log into your reporting team’s Google account (or create one if there isn’t one already — the reason is you want one login that multiple people can have access to — and you likely don’t want anyone to be constantly logging into your own account. Whatever login you choose, make sure it’s added as a user to the GSheet you just created) and go to https://datastudio.google.com/ and select the “Create” button, then “Report.”
Next, Data Studio will ask you to Add data to the report. Select “Google Sheets.”
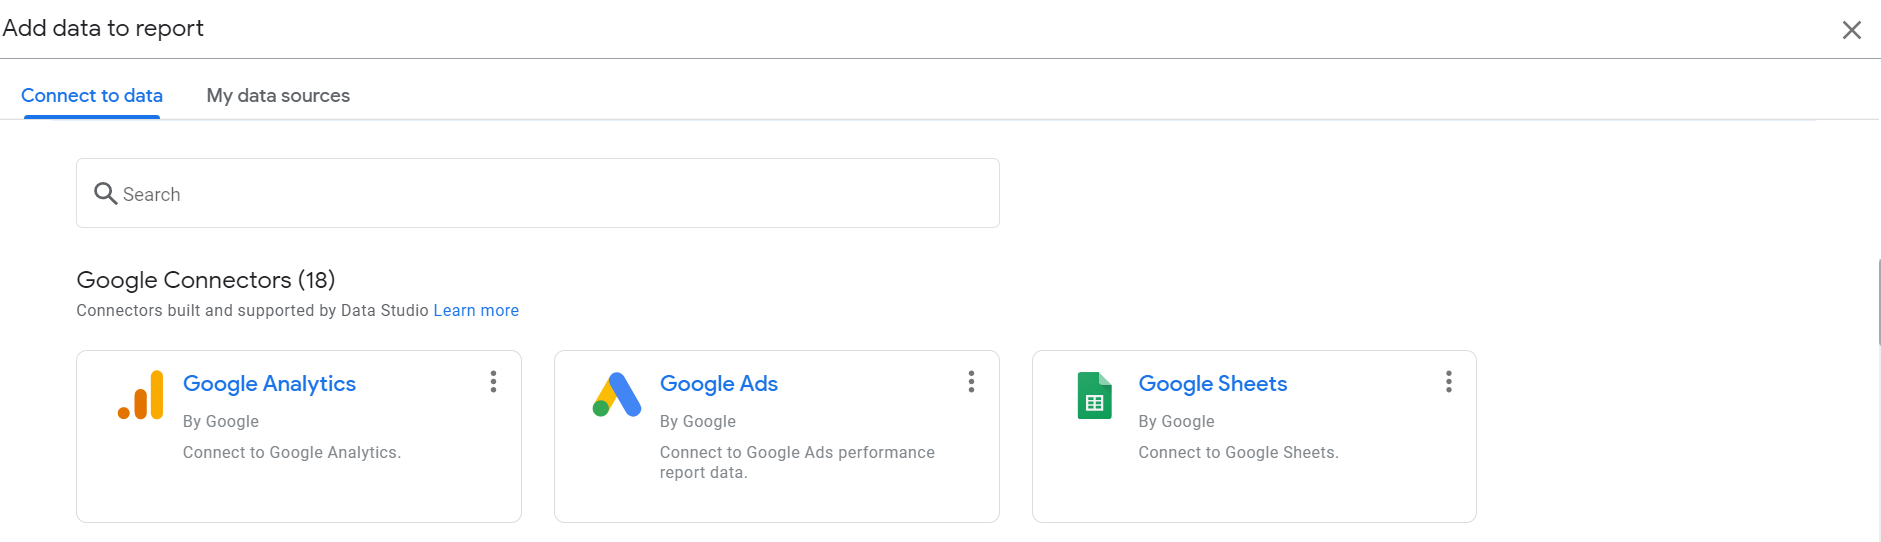
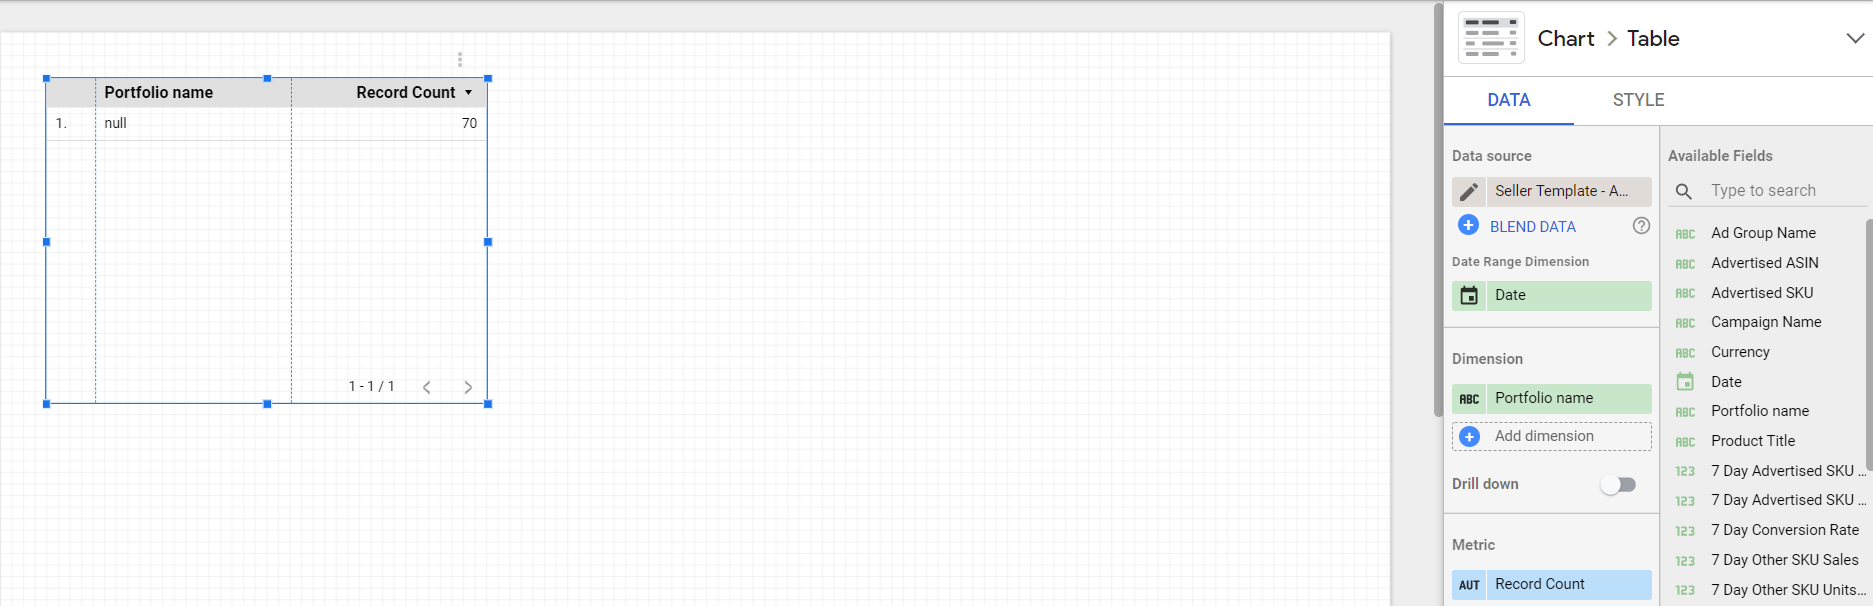
Then select the GSheet you just created in Step 2. If you’ve done everything correctly, it should look like this:

Which is not very impressive.
But it will be.
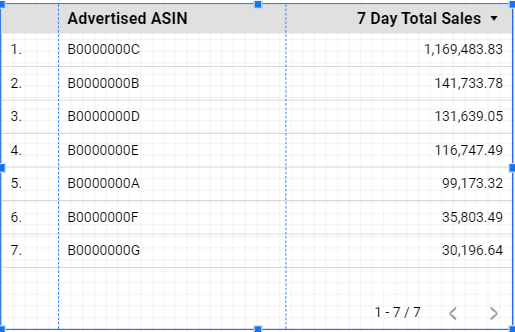
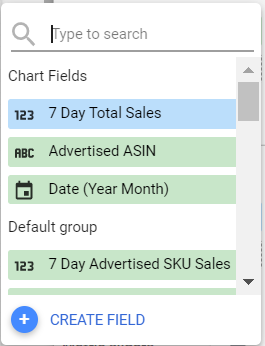
Click on that table, and on the right-hand side of your screen, a panel will pop up asking you to customize your dimensions and metrics.
If you click on the “Dimension” bar, a dropdown should appear. Let’s select “Advertised ASIN.” If you click on the “Metric” bar, you should also see a dropdown, select “7 Day Total Sales.” Now your table should look something like this:
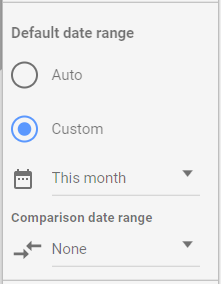
If you want to look at the sales over a specific time period, go back to the right-hand panel, scroll down to where it says “Default date range,” and select “Custom”
If you want to add “Spend,” “Clicks,” Impressions,” etc. to your table, feel free to do so. I will warn you that calculated metrics, such as CTR, Conv. rate, CPC do not play as well with Data Studio and may not be as reliable as non-calculated metrics — however, there’s a workaround for that, too.
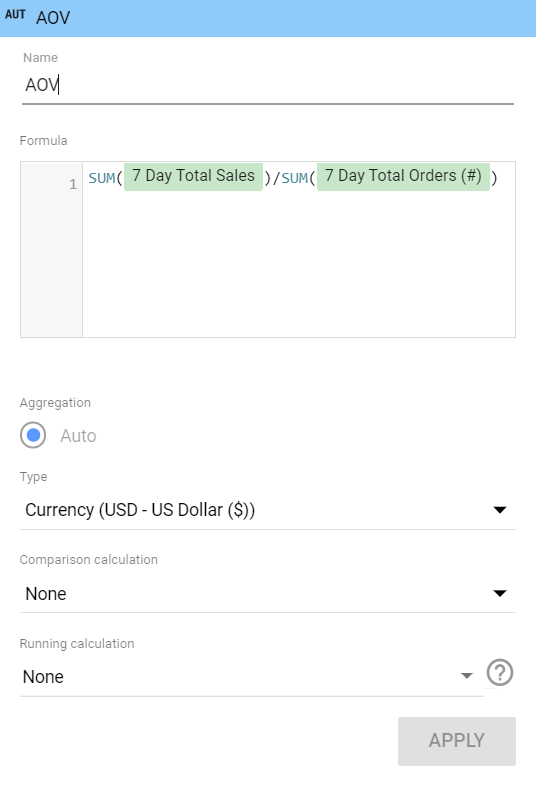
Let’s say we want to create a new field for Average Order Value, which isn’t available in our Advertised Product Report. In Data Studio, you can actually create your own metric by clicking “Add metric,” then “CREATE FIELD.”
A window will pop up where you can write your own formula — in this case, we want to divide 7 Day Total Sales by 7 Day Total Orders, and the formula you need should read like this:
SUM (7 Day Total Sales)/SUM (7 Day Total Orders(#))
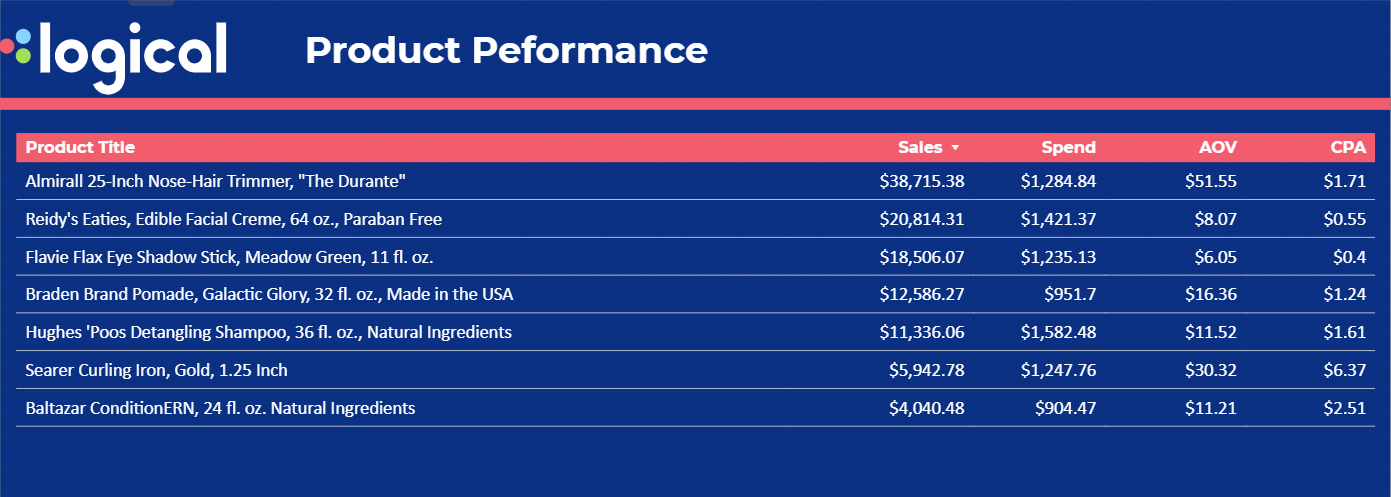
If you don’t get it on the first try, don’t worry — Data Studio can be finicky, but it won’t be long before your table will be looking something like this:
The last thing we’ll cover in this article is another great feature of Data Studio: Comparisons.
Go back to Amazon and pull the prior month’s Advertised Product Report. Paste it in your GSheet, then wait about fifteen to 30 minutes for that data to start pulling through to your Data Studio report.
Once it does, click back on your table to open up the right-hand panel and scroll back down to where it says “Default date range.” Select the drop down under “Comparison date range,” and select the option for “Previous period.” If all goes well, your table should now look like this:
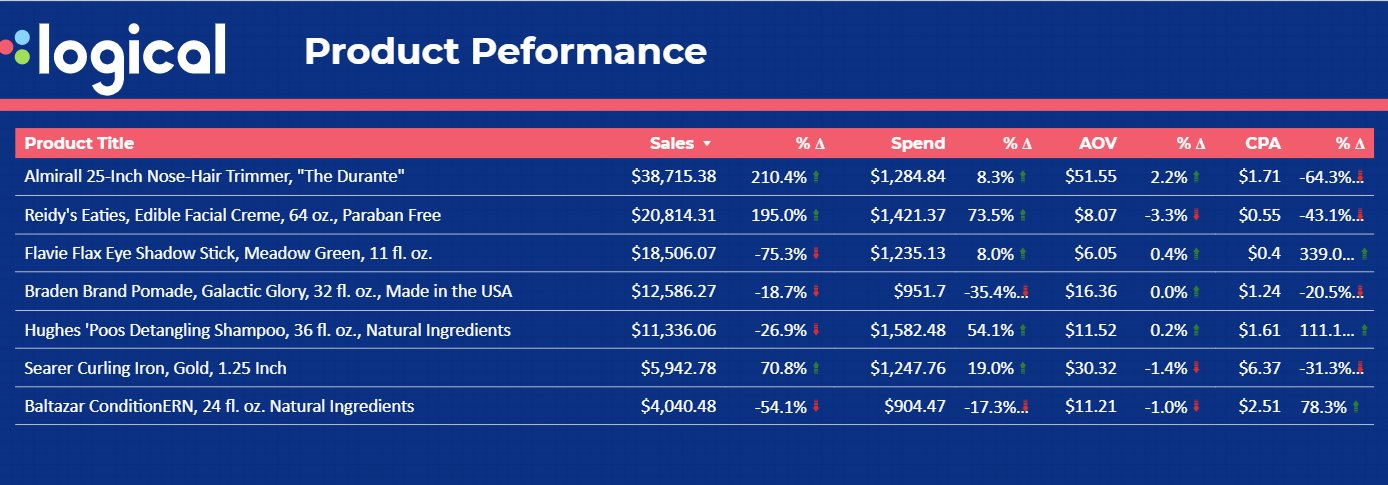
In other words, you can track month-over-month product performance for your advertised products!
And if you get stuck at any of these steps or are about ready to throw your computer at the nearest innocent’s head, don’t fret — like I said, Data Studio can be tricky, but it’s also fairly intuitive. If you keep seeing “No Data” in your table, check your “Date Range Dimension” and play around with some of the formats. Make sure you’re pulling in the correct GSheet tab, and walk through the guide again. You’ll get there, and hopefully it’ll save you lots of time.
If you’re still stuck (or you’ve gotten it to work but don’t like the trends you’re seeing), let us know!
Again, it may be tedious and time-consuming at first, but it will save a lot of time once it’s automated and you have everything set up.[/vc_column_text][/vc_column][/vc_row][vc_row type=”in_container” full_screen_row_position=”middle” column_margin=”default” column_direction=”default” column_direction_tablet=”default” column_direction_phone=”default” scene_position=”center” text_color=”dark” text_align=”left” row_border_radius=”none” row_border_radius_applies=”bg” overlay_strength=”0.3″ gradient_direction=”left_to_right” shape_divider_position=”bottom” bg_image_animation=”none”][vc_column column_padding=”no-extra-padding” column_padding_tablet=”inherit” column_padding_phone=”inherit” column_padding_position=”all” background_color_opacity=”1″ background_hover_color_opacity=”1″ column_shadow=”none” column_border_radius=”none” column_link_target=”_self” gradient_direction=”left_to_right” overlay_strength=”0.3″ width=”1/1″ tablet_width_inherit=”default” tablet_text_alignment=”default” phone_text_alignment=”default” column_border_width=”none” column_border_style=”solid” bg_image_animation=”none”][/vc_column][/vc_row]