No matter what your business goals are in the digital space, one of the most powerful tools available is Google Analytics. Not only is the software free to use, but when used correctly you can understand the impact of your marketing efforts without any doubt.
Let’s say you’re familiar with Google Analytics, though. You can effectively navigate to the data sets you need. Traffic by channel? Easy: Acquisition → All Traffic → Channels. However, have you utilized custom reports? Creating custom reports in Google Analytics can provide a new level of personalization and data set specificity you can only get through the default routes after multiple filters or maybe even not at all. So, let’s go about setting up some custom reports.

Identify Goals
The first step to creating custom reports in Google Analytics successfully is to identify what data sets you want to look at. An easy way to get a few quick report ideas may be typical filters you apply to data sets in Google Analytics. Do you frequently filter down to organic traffic? Create a custom report that’s already prefiltered! Another approach is to ask yourself what you want to see based on marketing efforts. Have a specific email campaign that targets a certain audience? Create a custom report!
Navigating Custom Reports
When creating custom reports, there are a few different options available. The first will be Report Tabs, which allow you to create multiple sub-reports in a single spot. From there we have three options for type:
- Explorer – Allows you to create drill-down data sets
- Flat Table – Creates a locked table with Dimensions and Metrics
- Map Overlay – Creates a drill-down report with an interactive map
There are benefits to all three, so which type you choose will be based on what data you want to look at.
Once you have a report type(s) selected, you’ll need to select Metrics and Dimensions. In most cases, your Dimension will be your y-axis on the data table and the Metrics will be along your x-axis; or rather Dimensions and Metrics are rows and columns respectively. A little bit more detail behind Dimensions and Metrics:
- Dimension – these are the characteristics of your users visiting the site. These include things such as source, medium, device, landing page, age, location, etc.
- Metric – these are the measurable numbers behind different data set for your Dimensions. These include sessions, users, bounce rate, conversions, etc.
Once you’ve selected applicable Metrics and Dimensions, you have the option of applying filters. Filters in custom reports target Dimensions and can be used to include or exclude users based on parameters. For example, you could only include traffic from organic sources. Or creating a custom report in Google Analytics to look only at blog pages may include only sessions where the Page contains /blog/. Filters can be a powerful tool to help make your reports even more valuable.
Lastly, you have the option of extending this report to multiple views within you Google Analytics account. This makes it easier to use the same reports across multiple views in your GA property without needed to recreate the report over again.
Sample Reports
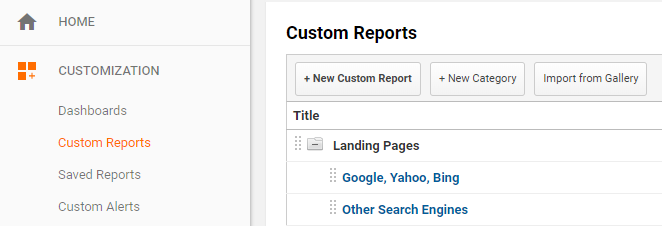
Ready to create your first report? You can find everything you need under Customization. We’ll start by creating a new report.
Our first step will be to assign this report a name; something that aligns with the purpose of the report. We’ll create a report that displays only Organic traffic from Google, so “Organic Traffic – Google” would be appropriate. Our report is named “Logical Media Group Custom Report Example” for the purpose of this blog and you can download the share link here.
For this example, we’ll be touching on all three types of reports and utilizing as many features as possible to give a comprehensive overview. We’ll add three report tabs, one for each report, that will showcase an overview of Organic traffic, some simple Landing Page analysis, and a Location report.
Organic Traffic Overview
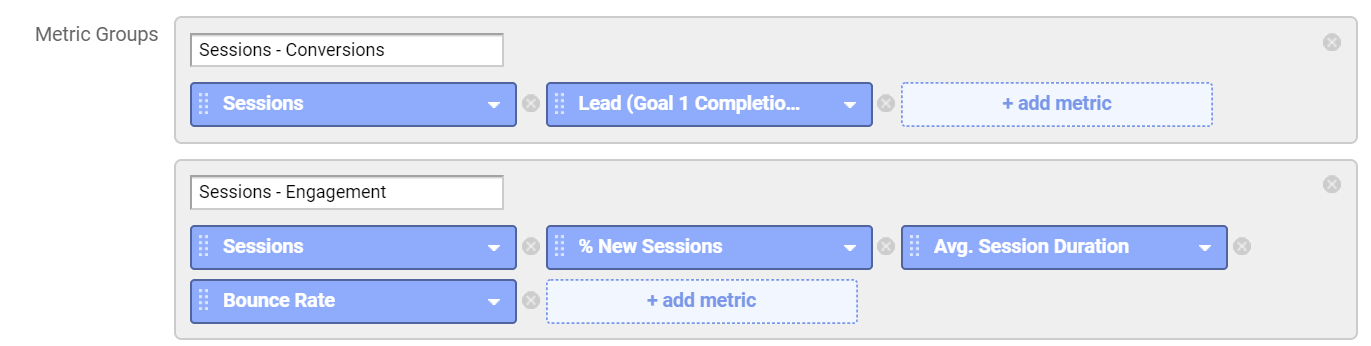
We’ll build this portion as an Explorer report so we can drill-down into Dimensions. We’ll also make use of multiple Metric groups, one for conversions and one for engagement. These Metric groups are below:
While pretty basic, these will give us valuable information. The first set allows us to views number of sessions compared to our Goal 1 Completion, which is a lead. We’ll also add in a third Metric for Conversion Rate, so we can see if those rates have improved or declined when comparing timeframes.
Our second set will show us some engagement Metrics to evaluate how users are interacting with our site. These include the Percentage of New Sessions, Average Session Duration, and Bounce Rate.
Now that our Metrics are set, we need some useful Dimensions.
Since we’ll be applying a filter for Organic traffic, we can start by viewing the Source of our traffic, so we can see what search engines are driving traffic to our site, and how much from each. After that, we’ll add a second Dimension to see what Device Category our users fall into from each Source. This way, we can see total traffic from Google, then drill-down and see the splits between Desktop, Tablet, and Mobile.
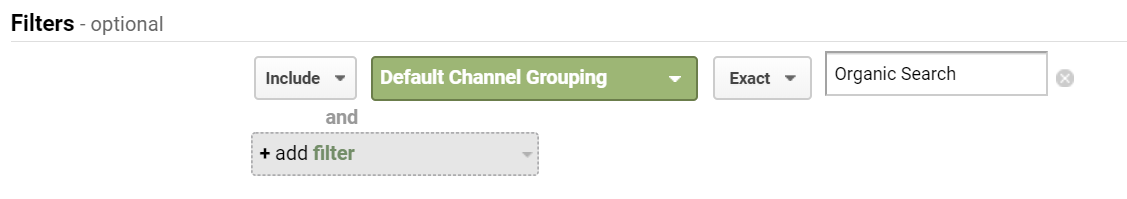
Lastly, we need to add the filter for our report.
By including only traffic where the Default Channel Grouping is Organic Search, we can filter out other forms of traffic, giving us a comprehensive look at only Organic. This filter will also carry over to all tabs in this report, so we don’t need to repeat this step for the other portions.
Landing Pages
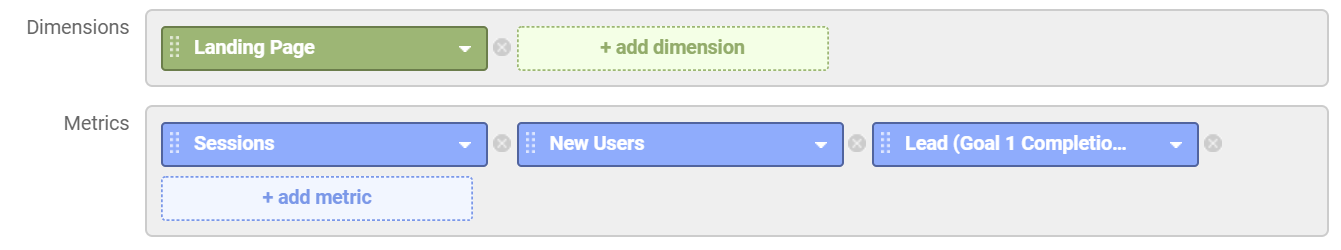
For this portion of the report, we’ll create a new Report Tab and set the type to Flat Table. Since we’ll be looking at landing pages (or which pages users entered our site on) with a couple of metrics at once with no need to drill-down.
Naturally, our Dimension for this report will be landing pages. From there, we may want to see total Sessions, how many New Users entered on that page, and how many of the landing pages resulted in a Conversion.
A pretty simple, straightforward build. Flat Tables are perfect for quickly displaying high level information.
Traffic Locations
Our last Report Tab will be pretty simple as well, with the intention of showing us where across the world our traffic is coming from. For this example, we’ve started at a very high level, and added in metrics for Sessions and Conversions.
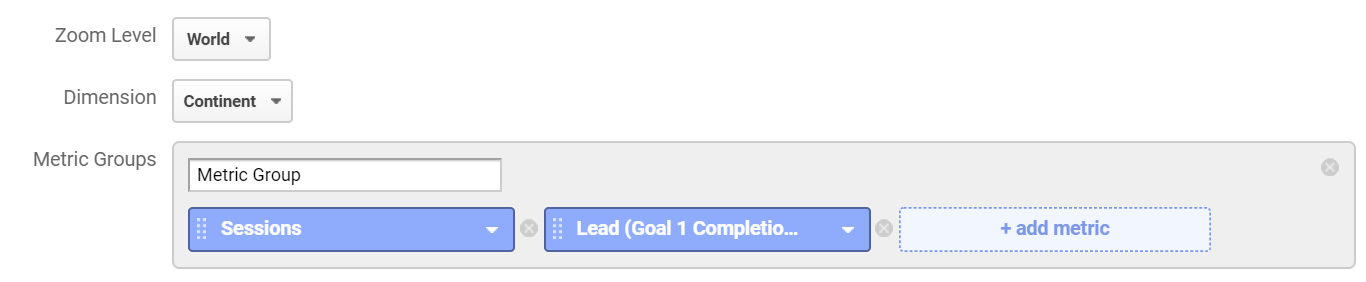
This will give us a quick look at our Sessions broken out across the globe, which then then be drilled-down into Sub-Continent, Country, Region, and finally City.
One Step Further
There we have it! We’ve now built a comprehensive custom report for organic traffic that looks at Conversions by source, traffic engagement, landing page performance, and location sources. While you can essentially filter down or navigate to various sections in Google Analytics and see this same data, custom reports give you the power to put exactly what you want in a single place. Keep in mind though that this is by no means an end-all-be-all report; you can create your own to fit any need. For your application, it may be more helpful to create an Explorer report where you look at landing pages first, then drill down to Source, followed by Medium. What type of custom reports using Google Analytics have you built? Let us know in the comments!
In case you missed it, a share link for the report example we used can be found here.